Bloglovin

Follow on Bloglovin

Friday, October 17, 2014

Better Than an Anchor Chart

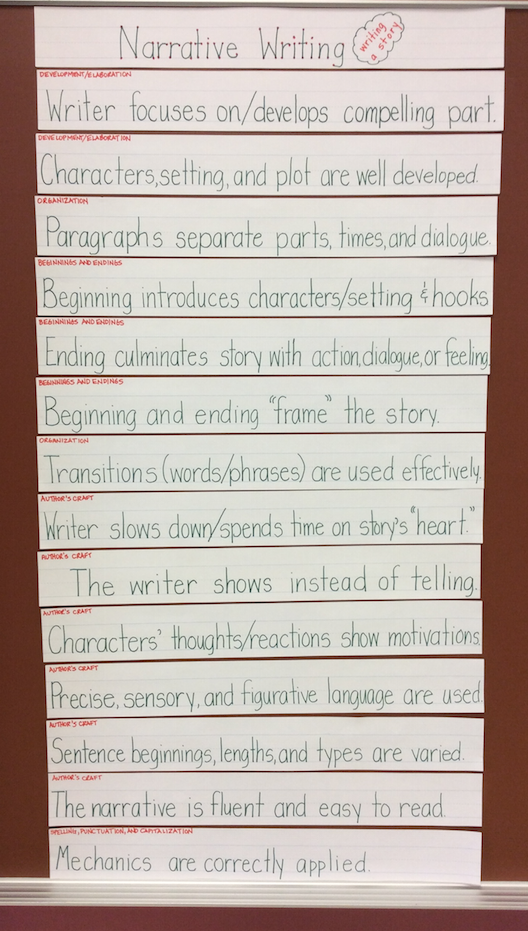
I find anchor charts to be clear, engaging . . . and limiting. You can create flexible charts using sentence strips, magnets, and tape. Here's how:

Step 1: Generate a list of the ultimate criteria for a specific skill or concept.


Step 2: Gather sentence strips, a marker, tape, and magnets. (In this case, I used outdated refrigerator magnets and cut them in strips.)


Step 3: Create a sentence strip for each criterion. Tape magnet strips to the back of each strip.


After you have created strips for each criterion, you can pick and choose as needed. For example, if my class was working on beginnings and endings, I might only display related strips:


Enjoy!
Brenda


Monday, October 13, 2014

Minds in Bloom

I'm honored to be a guest blogger for Rachel Lynette's blog, Minds in Bloom! If you're a frequent reader, you already know that I'm a passionate advocate of research-based instructional practices that focus on the standards. Check out my blog post to learn how to unwrap a standard, use backward design to create a unit plan, and employ a complete learning cycle to maximize learning.

Enjoy!
Brenda

P.S. If you need task cards for your intermediate-level class, please visit Rachel Lynette's Teachers pay Teachers store!

Sunday, October 5, 2014

Halloween Area Activity

Have some fun finding area of irregular shapes with Halloween cookie cutters!

Materials: centimeter graph paper, Halloween cookie cutters, paper plate or plastic lid, paint


Step 1: Dip the cookie cutter in the paint.


Step 2: Press the cookie cutter firmly onto the graph paper.


Step 3: Count the square centimeters. (Partials should be counted as partial squares and added.)


Extension: Ask students to figure out other (faster?) ways to determine area. For example, maybe they'll draw a rectangle around the shape, multiply length by width to determine total area then subtract squares inside the rectangle but not inside the shape. Or maybe they'll draw a rectangle inside the shape and multiply length by width to determine the middle of the shape then add the rest. Shhh, don't tell them, though! Half the fun (and learning) can be found in thinking up new ways on their own.

Looking for more activities like this? Check out Halloween Metric Measurement Activities!

Enjoy!
Brenda

Saturday, October 4, 2014

Teachable Moment: Data Analysis

My fourth grade students need to know about mean, median, mode, and range (not to mention processes for crunching numbers and displaying data). Unfortunately, data analysis is one of the last math units we tackle each year. How could I introduce these concepts earlier in the year without disrupting my math schedule?


This week, I gave my students a science pretest on sound. Ah-ha! A teachable moment! I gathered their scores.


We took a look at the raw data, and ugh! What a mess. We couldn't make heads or tails of this.


After organizing the data from lowest to highest, things became clearer. Students could see which number occurred most often (mode), the middle number (median), and the difference between the highest and lowest numbers (range).


They got out their calculators to find the sum of all data points. Then they simply divided by the total number of scores. Voila! We had the mean, or average.


We reviewed the new vocabulary: MOde occurs MOst often, median is in the middle (just like the median between lanes on a highway), range tells the spread, and mean is the average (equal distribution). I plan to review these terms and how to use them over the course of the year, whenever possible. In my experience, repeated exposure to a set of concepts works better than simply teaching a unit of study once.

For the grand finale, I introduced line plots. These simple little graphs pop up on standardized tests all the time, but students rarely see them in the classroom.


Each piece of data is represented by one "x"---to show frequency. We talked about clusters (places on the line plot where data is clustered) and outliers (pieces of data that are set away from clusters), as well as how this graph helps us summarize and analyze the data quickly and easily.

We spent 10 to 15 minutes discussing data analysis: just a quick hit. I'm glad I grabbed this "teachable moment" with my students!

Brenda

P.S. This mini-lesson also got my students thinking about their own learning (metacognition!) After analyzing the data, we could clearly see that the average score (9.74 out of 14, which was less than 70%) was in the "poor" category. Even though three students were in the "B" range (12 out of 14 correct), they did not know two key concepts about sound. Did our class need more review on this third grade standard? The answer was a resounding and unanimous "yes!" 

The next day they moved through six sound centers and made generalizations. After discussing thoroughly as a class, exploring a bit more with some websites, and practicing with flashcards and a study guide, we'll retest again on Monday. I feel confident that their scores will be high . . . and maybe it will be time for a little more data analysis!

Thursday, September 4, 2014

RL.4.6 from a Child's Perspective

My fourth grade class has been working on determining point of view, and I just have to share this precious response with you:

It was written in first person 
because the person told the story,
but not behind his back.

I love it!

Here's how we tackled RL.4.6 this year:

  • To understand first- and third-person narratives, students must know about first-, second-, and third-person pronouns. On the first day, we launched into an exploration of pronouns.


  • Next, students viewed a PowerPoint presentation that taught them how to determine point of view. If the excerpt was written in first person, they held up one finger; if it was written in third person, they held up three fingers. (They also had a blast naming the picture books from which the excerpts came!)


  • After quite a bit of guided practice, each student completed two independent worksheets to practice on their own.


  • Once my students proved that they could determine point of view, it was time to watch another PowerPoint presentation. In the true spirit of the Common Core, they learned to write a topic sentence that told the point of view and included the title of the publication. Then they defended their choice by explaining whether any of the characters were narrating. 


  • Next, I provided some guided practice using an excerpt from Swiss Family Robinson.


  • My students were finally ready to determine and defend point of view on their own. We practiced for three days with excerpts from Alice in Wonderland, Huckleberry Finn, and Treasure Island. Each student was able to read a text suitable to his or her own reading level. At first, my students' point of view paragraphs were naive and not very clear, but they improved every day. We read student exemplars and noticed that paragraphs explaining whether the narrator was inside or outside the story provided the strongest defense. 


  • After all of this, I felt confident that my class was ready for assessment. They read an excerpt from The Wizard of Oz, determined its point of view, and defended it in a paragraph.

The Common Core State Standards have changed the way I teach point of view, and I think it's for the better!

Brenda

Sunday, August 31, 2014

Teaching Is Like Riding a Bicycle

Teaching is like riding a bicycle. Once you learn, you'll never forget. Writing a thorough lesson plan gets you up on that bike, rolling down the sidewalk.


New standards provide a framework for excellence in teaching, but in reality, it's just oh-so-easy to pick up that old textbook and teach it from cover to cover. Teacher evaluation programs give us much more specific criteria, but they only assess. What would happen if we coached teachers to create thorough lesson plans and then assessed those showcase lessons? Teaching and learning would improve.

Let's bring back the bicycle analogy. Teaching a child in a school setting is like teaching a child to ride a bicycle:

  1. Objective - We explain the point: "Today you will learn how to ride a bicycle."
  2. Direct Instruction and Modeling - We tell them how to do it and show by doing it ourselves.
  3. Guided Practice - We hold them up and run along beside them while they try it.
  4. Formative Assessment - We ask how it's going. We let go and and see what happens.
  5. Independent Practice - We ask them to do it themselves - - - over and over until they get good at it.
  6. Differentiation - We use strategies to address different rates or ways they learn.
  7. Collaboration - We let them try it with their friends.
  8. Higher Order Thinking Skills - We take them to a new level.
  9. Assessment - We test them out to see if they're ready to venture out on their own.
Using these time-tested strategies is essential to a high score on teacher evaluation rubrics. More importantly, they're essential to good teaching and learning. 

Brenda

Monday, August 25, 2014

My First Year of Teaching

Flash back to 1983. I arrive, young and bright-eyed for my first day of teaching.

What age group and subject(s) were you teaching?  I taught a class of 18 fourth graders.

What was your first classroom like? I remember four light green glazed brick walls. The front wall had a blackboard flanked by two empty bulletin boards. The back wall was totally covered with three large bulletin boards. One side wall had a coat room, a teacher closet, and the door; the other held a big, noisy heater (no air conditioning) and rows of low shelves. Above the shelves were rows of windows with round stickers on their edges. The stickers marked the exact position each window shade had to be at the end of each day (or else you would be written up by the superintendent!) I vividly remember my reaction to that first room: What will I put on all of those empty shelves and bulletin boards???

Technology in my classroom amounted to the chalkboard. That's it. I could borrow a 16 mm film projector (with a big reel of film) or a film strip projector from the library. That fall we were fortunate to receive our first copy machine, and later in the year we got two Apple IIe computers (no software, no Internet...just two computers for which we had to write code.)

Were you given supplies and materials? When I entered the building a few days before school started, the principal handed me a key, a box of chalk, an American flag, and a ream of brown construction paper. He pointed me down the hall to my room, and that was it. Later, after I begged for more supplies, he gave me a pair of ancient scissors, a tape dispenser, and a used plan book. You may think I'm joking, but I'm not.

Fortunately, after a very short amount of time, I was able to order  a limited amount of supplies, such as tape, staples, glue, and more construction paper. The PTO supplied classroom games. I will say, however, that it took years for me to fill the small amount of storage space I had in that classroom. How ironic, when I now wish I had less stuff!

What was the hardest part of your first year of teaching? The hardest part of my first year of teaching was that I didn't really know how to teach or how to manage a classroom. At the time, I felt frustrated, but I really don't think I realized how little I knew.

What was the best part of your first year of teaching? Teaching and learning! Learning and teaching! It was magical!

What do you know now that you wish you knew that first year? Oh my. Nothing. As they say, ignorance is bliss. And education is a journey.

Times have changed. Teaching has changed. I have changed. But I wouldn't change a thing.

Many thanks to Laurah J. of the ESOL Odyssey for prompting this blog.


Brenda